|
|
|
| |
|
|
| |
|
|
|
|
|
|
|
|
|
|
|
|
|
|
|
|
|
|
|
|
|
|
|
| |
|
|
| |
PowerDebug System
|
|
| |
|
|
| |
|
|
| |
|
|
| |
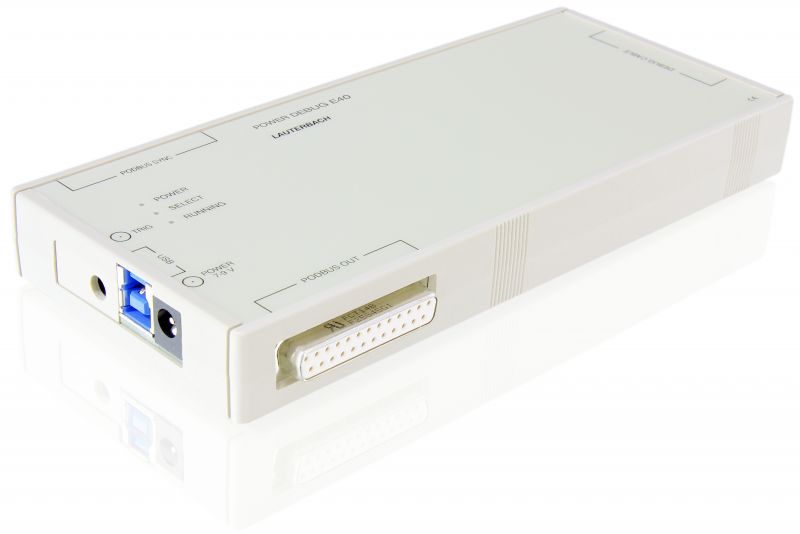
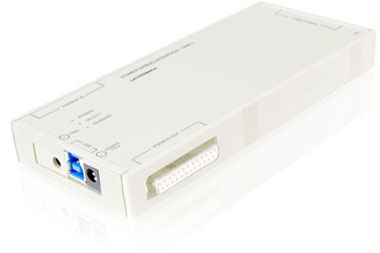
PowerDebug E40
|
|
| |
Highlights
|
|
| |
|
|
A Powerful Standard
Debugger
The PowerDebug E40 is our essential-line
debug controller, offering you the
performance to help you power through
simple and complex debug tasks. It
supports USB3 high speed
connection to
the host, and can be extended with
logic
analyzer modules. Our universal
debug
tool is designed to maximize your
productivity and return on investment.
The energy-efficient design allows a
fanless operation for silent debugging.
|
|
|
| |
|
|
| |
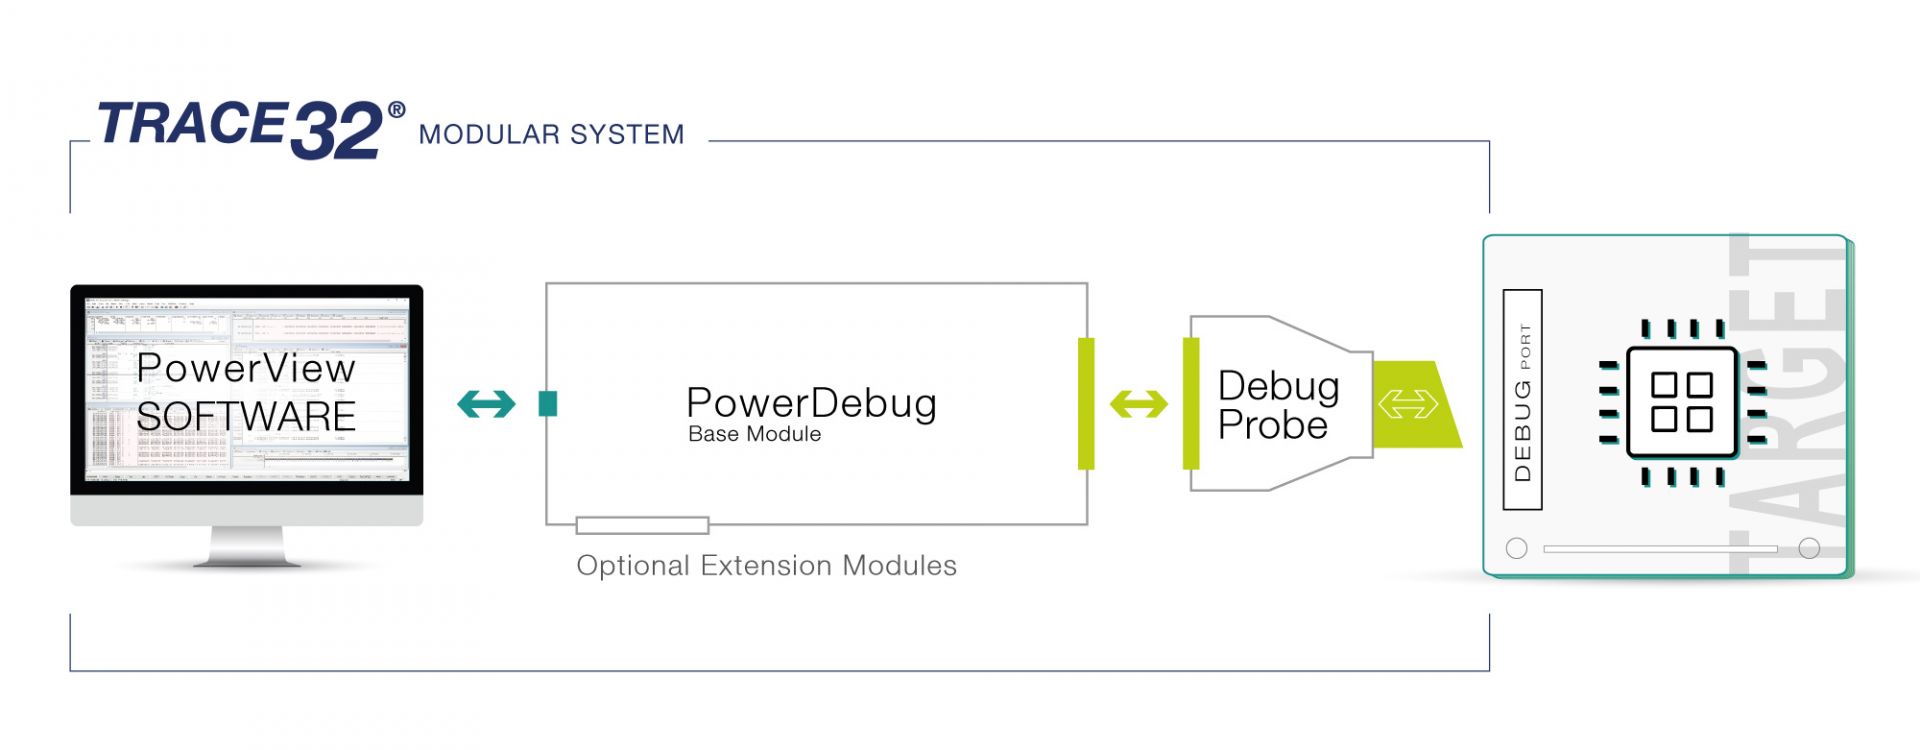
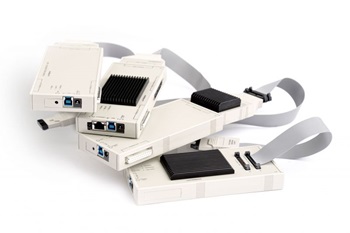
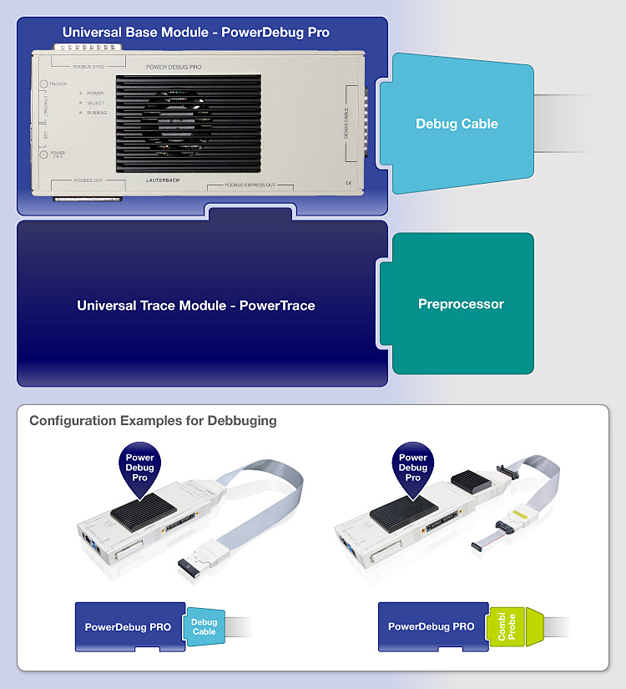
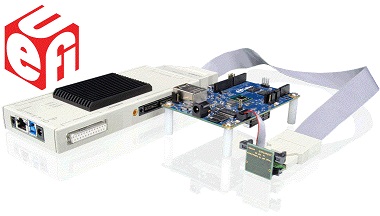
PowerDebug System
Modular and Powerful Debug System
PowerDebug is a powerful, modular, flexible debug system that adapts and grows with you as you move from project to project and chip to chip. It provides the broadest coverage of supported chips and core architectures in the embedded industry.
Start with a universal PowerDebug module and target-specific debug probe. Extend your debug system with trace and logic analyzer modules for run-time analysis, code coverage, or in-depth troubleshooting.
|
|
|
|
|
| |
|
|
| |
|
|
| |
|
|
|
|
|
| |
|
|
| |
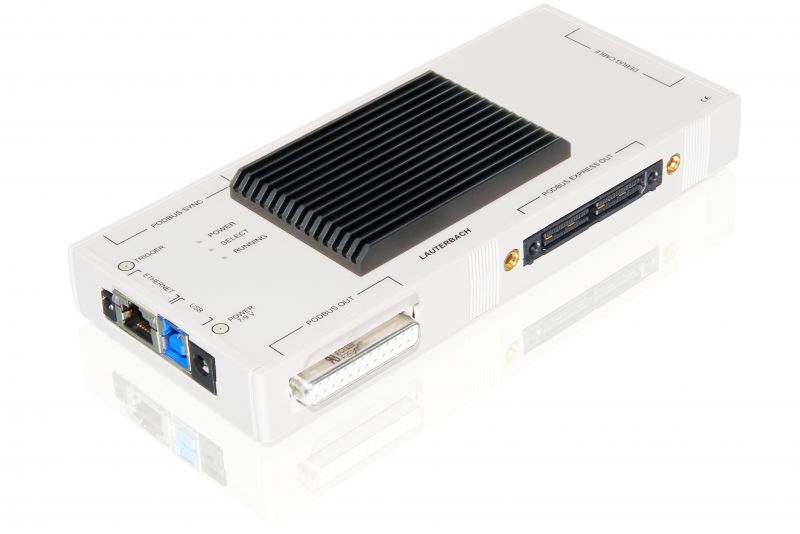
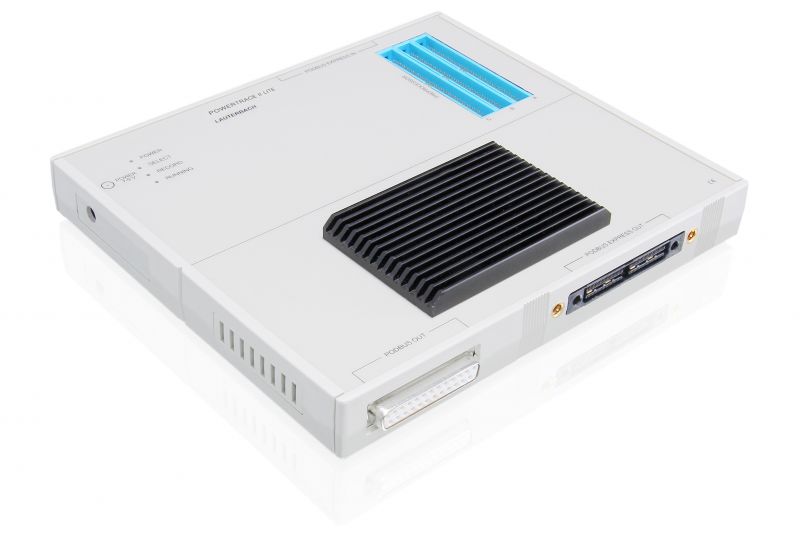
PowerDebug X50
|
|
| |
Highlights
|
|
| |
Expandable,
High-performance Debugger
PowerDebug X50 is our high-performance,
modular, and future-proof debug
controller. It can be expanded with
PowerTrace, our leading embedded
off-chip trace solution, as well as our
logic-analyzers. You can connect it to
your PC via USB 3 or Gigabit Ethernet,
making it the perfect solution for both
on-site and remote debugging.
No matter what your application looks
like today or in the future, the
PowerDebug X50 meets all your
challenges, maximizes your productivity,
and ensures a valuable return on
investment.
|
|
|
|
|
| |
|
|
| |
Configuration Overview
|
|
| |
|
|
| |
|
|
| |
|
|
| |
|
|
| |
|
|
| |
Trace Extensions
|
|
| |
PowerTrace Serial 2
|
|
| |
- 4 GByte or 8 GByte memory
- High-performance serial tracing application
- Maximum Bandwidth 80 Gbit/s
- 10 000 / 400 MByte/s Streaming Performance (Peak / Average)
- Parallel Trace: NA
- Serial Trace via Aurora/HSSTP: 12.5 Gbit/s per lane2 @ 8 lanes, 22.5 Gbit/s per lane2 @ 4 lanes1
- Serial Trace via PCIe: PCIe Gen 2/3 x8, PCIe Gen 4 x47
|
|
|
|
|
| |
|
|
| |
PowerTrace III
|
|
| |
|
|
| |

|
|
High-performance parallel trace extension:
- Memory Size: 4 GByte or 8 GByte
- Application: High-performance parallel tracing
- Maximum Bandwidth: 19.2 Gbit/s
- Streaming Performance1 (Peak / Average): 2 400 / 400 MByte/s
- Parallel Trace1: Up to 36 lines 600+ Mbit/s per line @ 17 lines, 350 Mbit/s per line @ 36 lines
- Serial Trace: Up to 4 lanes2,3 6.25 Gbit/s per lane @3 lanes, 5.00 Gbit/s per lane @4 lanes
- Option for logic analyzer and energy profiling: Via Mixed-Signal Probe
- Required debug module: PowerDebug X506
|
|
|
| |
|
|
| |
|
|
| |
PowerTrace II LITE
|
|
| |
|
|
| |
Cost effective parallel trace extension:
- Memory Size: 1 GByte
- Application: Parallel trace
- Maximum Bandwidth: 10.8 Gbit/s
- Streaming Performance1 (Peak / Average): 1 350 / 100 MByte/s
- Parallel Trace2: Up to 36 lines 600+ Mbit/s per line @ 9 lines, 450 Mbit/s per line @ 17 lines, 225 Mbit/s per line @ 36 lines
- Serial Trace: Up to 4 lanes3,4 6.25 Gbit/s per lane @2 lanes, 4.50 Gbit/s per lane @3 lanes, 3.38 Gbit/s per lane @ 4 lanes
- Option for logic analyzer and energy profiling: Not Available
- Required debug module: PowerDebug X506
|
|
|
|
|
| |
|
|
|
|
|
| |
|
|
| |
Debugger Features
|
|
| |
|
|
| |
|
|
- Multicore Debugging
- Peripheral Browser
- FLASH Programming (Memory-Mapped)
- FLASH Programming (Protocol-Based)
- HLL Debugger
- Sample-based Profiling
- MMU Support
- UEFI Bootloader
- Hypervisor-aware Debugging
- OS-aware Debugging
- Android Debugging
|
|
|
| |
|
|
| |
Multicore Debugging
|
|
| |
|
|
| |
- Debugger for all cores of a
multicore chip
- Debugging of application cores,
DSPs, accelerator
cores and special-purpose cores
- Debugging of more than 80 core
architectures
- Support for every multicore topology
- Support for all multicore operation
modes
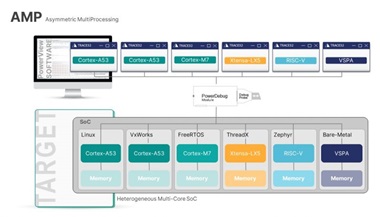
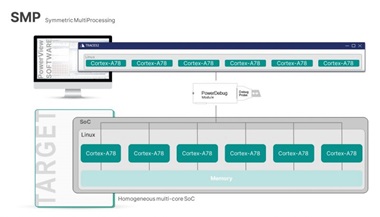
- Support for AMP and SMP systems
- Single debug hardware can be
licensed for all cores
of a multicore chip
|
|
|
|
|
| |
|
|
| |
Logical Display of Peripherals
|
|
| |
|
|
| |
|
|
- Display of onchip peripherals
- User definable windows
- Interactive window definition with
softkey support
- Pulldown menues for selection of
choices
- Additional description for each
field
|
|
|
| |
|
|
| |
FLASH Programming (Memory-Mapped)
|
|
| |
|
|
| |
- Optimum flash programming
performance
- Support for all file formats
- Ready-to-run flash scripts
- Ready-to-use flash programming
algorithms
- Dialog- or command-based programming
as well as full
scripting
- Full awareness of sensitive data
- Flash declaration via CFI
- Easy handling of different flash
types on a target
- Software breakpoints in flash
- Simple code patching in flash
- Flash programming via boundary scan
|
|
|
|
|
| |
|
|
| |
FLASH Programming (Protocol-Based)
|
|
| |
|
|
| |
|
|
- Optimum flash programming
performance
- Support for elf, Intel hex and
S-record format
- Ready-to-use flash programming
scripts
- Ready-to-use flash programming
algorithms
- Memory dump for displaying the flash
content
- Flash content can be easily copied
and modified
- Flash programming via boundary scan
(SPI, eMMC, I2C)
- Full programming access to spare
area (NAND)
- Bad block treatment (NAND)
- ECC generation: Hamming, BCH,
Reed-Solomon (NAND)
|
|
|
| |
|
|
| |
High-Level-Language Debugging
|
|
| |
|
|
| |
- Supports multiple languages
- Full support for C++
- Integrated into TRACE32 environment
- Supports most compilers and
hosts
Same user interface on different
hosts
- High speed download
- Debugs optimized code
- Display of function nesting
- Display of linked lists
- Powerful expression evaluation
|
|
|
|
|
| |
|
|
| |
Sample-based Profiling
|
|
| |
|
|
| |
|
|
- Long-time performance analysis for
functions
- Long-time performance analysis for
tasks
- Long-time analysis of the contents
of a variable or
memory location and more
|
|
|
| |
|
|
| |
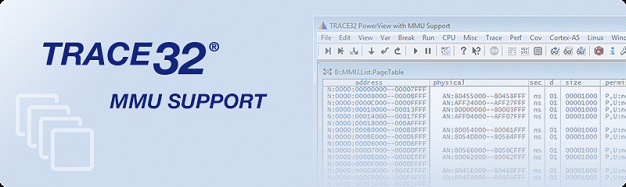
MMU Support
|
|
| |
|
|
| |
|
|
| |
- Full integrated support of processor's MMU
- Display of processor MMU registers
- Display of MMU table entries
- Display of address translation table
- 'Shadowing' MMU address translation inside
debugger
- Full virtual and physical access to target at
any
time
- Debugger has optionally write access to write
protected memory areas
- Detection and decoding of software MMU tables
built
by operating systems
- Support for several user space MMU tables side
by
side
- TLB context tracking and git statistics via CTS
|
|
| |
|
|
| |
|
|
| |
|
|
| |
Debug Support for Unified EFI Bootloader
|
|
| |
|
|
| |
- Support by a loadable extension
- Debug support for all UEFI
phases
Tailor-made display windows for each
UEFI phase
- Continuous solution without
"debug gap"
- Debugging from reset vector
- Debugging of dynamically loaded
drivers from their
entry point
|
|
|
|
|
| |
|
|
| |
Hypervisor-aware Debugging
|
|
| |
|
|
| |
|
|
- Seamless debugging of the total
system in stop-mode
- Hypervisor-awareness as a loadable
debug extension
is provided by Lauterbach
- Machine ID allows the user to
uniquely identify any
virtual machine in the system
- Machine ID provides full visibility
of context of
active and inactive virtual machines
- OS-awareness can be loaded for each
virtual machine
|
|
|
| |
|
|
| |
OS-aware Debugging
|
|
| |
|
|
| |
- Real-time, non-intrusive display of
RTOS system
resources
- Task stack coverage
- Task related breakpoints
- Task context display
- SMP support
- Task related performance measurement
- Statistic evaluation and graphic
display of task run
times
- Task related evaluation of function
run times
- PRACTICE functions for OS data
- Easy access via RTOS specific
pull-down menus
- Support for all major RTOSes
|
|
|
|
|
| |
|
|
| |
Android Debugging
|
|
| |
|
|
| |
|
|
- Stop-mode-debugging for ARM
- Support for Android L/M/N
- Debug information from Elf/DWARF
file or by parsing
the OAT data
- Full Android and OS-aware
interpretation based on
RAM dump on TRACE32 Debugger or on
TRACE32 Instruction
Set Simulator
- Android L/M
- Native Debugging of Android
Framework and Apps
(ahead-of-time compilation)
- Android N
- Display of the frame levels with
Java-to-native
transitions for interpreted code
- Native debugging of ahead-of-time
and just-in-time
compiled code
- Requires Linux OS-awareness
|
|
|
| |
|
|
| |
|
|
|
|
|
