| |
|
|
| |
|
|
| |
|
|
|
|
|
|
|
|
|
|
|
|
|
|
|
|
|
|
|
|
|
PC CAN
Software |
|
|
|
|
|
PC Software
|
|
|
|
|
|
PCAN-View
|
|
|
|
|
|
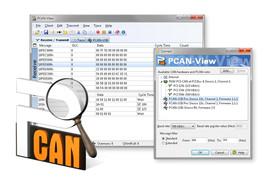
| The software PCAN-View
for Windows is a simple CAN monitor for viewing, transmitting, and
recording CAN data traffic.
Messages can be transmitted manually and periodically at a
user-determined bit rate. Bus system errors and memory overflows in
the CAN hardware are displayed during the
process. The trace function can be used to record and save CAN data
traffic.
|
|
|
|
PCAN-View is supplied with every PCAN PC hardware product and allows a quick and easy start. All available PEAK CAN interfaces are listed in the connection dialog. After selecting the hardware and the bit rate, the user can access all the software functions, hardware-specific settings, and information.
|
|
|
|
|
|
|
|
| |
|
|
|
|
|
|
|
|
|
|
|
|
PLIN-View
Pro
|
|
|
|
|
|
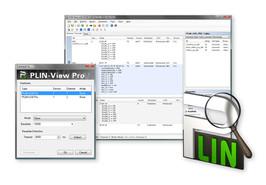
The LIN monitor
PLIN-View Pro for Windows is supplied with every PC LIN interface
from PEAK-System. Incoming LIN
messages can be viewed using this software, with the use of LDF files
(LIN Description File) allowing the symbolic depiction of LIN
messages. Outgoing LIN frames can be
defined depending on the master or slave operation mode.
PLIN-View Pro also accesses the LIN functionality of the supported
hardware, such as the on-board scheduler or automatic bit rate
detection.
|
|
|
|
|
|
|
|
|
|
| |
|
|
|
|
|
|
|
|