GI.bench comes with an enhanced user experience, intuitive navigation, and added
features.
PC-based Data Acquisition Software
GI.bench is a state-of-the-art data acquisition software environment that combines
system setup and configuration and logging and monitoring multiple data streams in
one easy-to-use desktop application. GI.bench enables you to configure, execute,
and analyze your testing and monitoring projects on the fly with access
high-availability measurement data, anywhere.
GI.bench for Modern and Robust Measurement Setups
The GI.bench software platform combines faster test setups, project configuration
and handling, as well as visualization of data streams in one digital
workbench.
It enables you to configure, execute and analyze your measurement and test tasks
on the fly. Access live and historical measurements data anywhere.
With GI.bench's UI design, experience the difference in accessing
high-availability measurement data, anywhere. Witness the power of the new
features in action with our Microphone demo.
To optimize your testing and monitoring projects, GI.bench now includes an
Oscilloscope widget with sin and rectangle wave functions and new FFT Chart.
Enhance your data analysis with the Statistics view in the marker window. Access
historical sources from a dedicated tree and view live data with a click. These
features of GI.bench enable you to configure, execute, and analyze your testing
and monitoring projects more efficiently.
Specifications
DAQ System Setup
I/O module configuration,
calibration, alarming
Project-based configuration
Channel groups and multichannel
editing
Import and export
Sensor database
Offline editing
Signal quick view
Easy Firmware Update
Structured view
Time zone adjusted
Our integrated CAN Editor provides a graphical
overview of CAN messages, enhancing your
system setup.
The Power Analyzer Configuration in
GI.bench is a click away. Link directly to the
Q.boost website for an advanced experience.
Configuring your data acquisition process is smooth with the Action Buttons column
including Tare, Zero, Shunt, Reset.
Data Logging
Multi-frequency data logging
Save data in different formats
Multiple logger modes
Parallel data logging Datastream merging
Armed State for logger button
Change the default download directory in settings, and control dashboard access
directly from the data acquisition toolbar.
Custom Dashboards
Configurable multi-tab dashboards
Remote viewing via any web browser
Save dashboard layouts with project
Real-time and historical data
YT, XY, Oscilloscope, FFT, Bar, 3D
Embedded IP camera stream
High-granularity zoom
Signal markers
Print and save to file
Direct access to the
Controller-Dashboard from the data
acquisition toolbar
Button to open default download
directory in left panel
The improved custom dashboards include
FFT evaluator configuration in variable
settings and FFT evaluator view in the
marker window.
Online Analysis
Engineering unit conversion
Real-time calculation
Frequency analysis
Rainflow counting
Data reduction methods
Intuitive
User Interface
Modern look and feel
Multilingual user interface
Context-sensitive help
Configuration self-check
GI.bench
offers an enhanced user interface with a modern
and sleek design, providing improved dialogues for
easier navigation and online measurements for
sensor definitions.
Upload your files easily with our File
Uploading feature and handle your data
conveniently with our CSV Export/Import feature.
Save your files directly to Archive for a
streamlined data handling process.
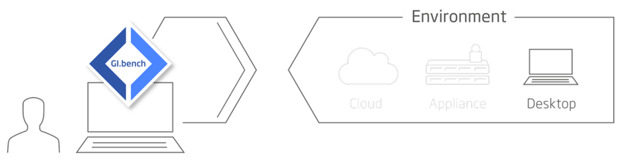
Advanced Features
Cloud edge device configuration
Third-party data stream integration
PubSub extensions for OPC UA, MQTT, DDS
Parameterization of CAN, EtherCAT,
PROFINET, test.con apps
Data acquisition with F108 Optical Gage
Amplifier and 4 MHz Q.boost
Advanced API for configuration and data
access
Includes an easy firmware update feature and
dialogs for a smooth user experience.
Features
Choose between free &
licensed plan
Feature
Free
Licensed
Configuration
Online project
configuration
Offline project
configuration
Project config
import/export
Sensor database
Advanced data stream
options
GI. cloud pairing
and remote service
DATA LOGGING
PC-based data
logging
1 logger
Unlimited
Controller-based
data logging
20 loggers
20 loggers
VISUALIZATION
Dashboard Designer
Browser-based
dashboard
30 min max
Unlimited
Data Viewing
30 min max
Unlimited
DATA PROCESSING
Virtual variables
and Arithmetic
on controller
on controller and PC
Test.con apps
Data Export
Benefits
Quick and Easy Setup of
Multi-channel Data Acquisition
Reduce setup time and cost to a minimum with
channel grouping, multichannel editing, and
robust configuration importing and
exporting.
Quick and Easy Setup of
Multi-channel Data Acquisition