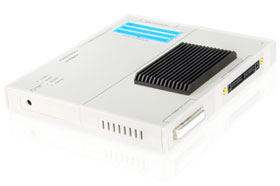
Trace memory within a TRACE32 Debug & Trace Tool
with a fixed size (128 MByte up to 4 GByte) for off-chip
trace ports
TRACE32 Debug & Trace Tool allows streaming of the
trace information to a file on the host computer whilst
it is being recorded. This provides the capability to
use trace memory buffers of to up to 1 T Frames.
Real-time processing of streamed trace information
provides virtually infinite trace (ETMv3 and PTM only)
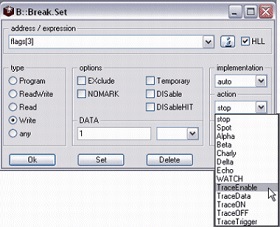
Trace Filter and Trigger
Sample only the specified event
Sample the complete program flow and the specified
data event
Switch the sampling to the trace buffer on/off after
a specified event occurred
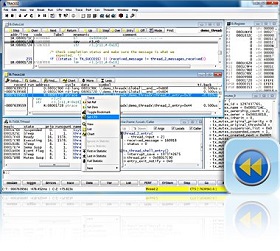
Trace-based Debugging (CTS)
Allows re-debuggging of a traced program section
Provides forward and backward debugging capabilities
High-level language trace display including all
local variables
Timing and function nesting display
Has the ability to fill most trace gaps caused by
the limited bandwidth of trace port
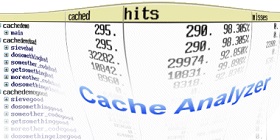
Trace-based Cache Analysis
Basic support for all microcontrollers
Advanced support for ARM architecture
Optimize instruction and data cache usage
Find bus transfer bottlenecks
Verify effects of code optimisation
Simulate effects of different cache sizes
Various graphical and numerical displays
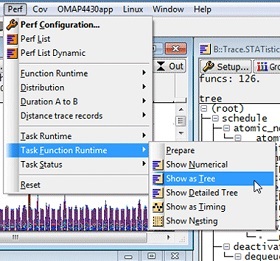
Trace-based Profiling
Detailed analysis of function run-times
Detailed analysis of task run-times and state
Graphical analysis of variable values over the time
Analysis of the time interval of a single event
(e.g. Interrupt)
Analysis of the time interval between 2 defined
events
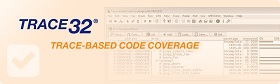
Trace-based Code Coverage
Real-time code coverage without instrumentation
Suitable for long-term testing
Support for all common code coverage metrics
Automated report generation
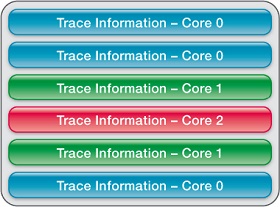
Full support of multicore chips
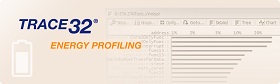
Energy Profiling
Find the program part causing the highest energy
consumption
Locate unexpected power peaks
Check if power-saving modes are used efficiently
Current and voltage measurement with TRACE32 Mixed
Signal Probe or TRACE32 Analog Probe
Time correlation with TRACE32 trace tools PowerTrace,
CombiProbe, MicroTrace
Energy statistics on function and task level
Copyright � 2004 - 2026 All
rights reserved. Embedded Systems Solutions Pvt Ltd.