|
|
|
| |
|
|
| |
|
|
|
|
|
|
|
|
|
|
|
|
|
|
|
|
|
|
|
|
|
|
|
| |
|
|
| |
|
|
| |
|
|
| |
|
|
| |
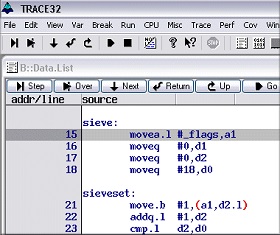
ASM Debugger
|
|
| |
|
|
- Supports almost all file formats
- Assembler source-level debugging
- Advanced memory display
- Inline assembler
- Memory tests
- Customizable windows
- Peripheral windows
- Terminal window
- Semi-hosting
- Flash programming
- Full support for peripherals
|
|
|
| |
|
|
| |
|
|
| |
|
|
|
|
|
| |
|
|
| |
High-Level-Language Debugging
|
|
| |
- Supports multiple languages
- Full support for C++
- Integrated into TRACE32 environment
- Supports most compilers and hosts
- Same user interface on different hosts
- High speed download
- Debugs optimized code
- Display of function nesting
- Display of linked lists
- Powerful expression evaluation
|
|
|
|
|
| |
|
|
| |
|
|
| |
|
|
|
|
|
| |
|
|
| |
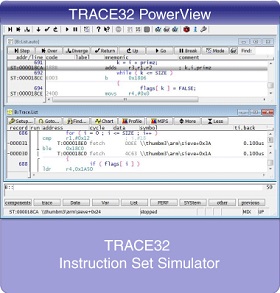
TRACE32 Instruction Set Simulators
|
|
| |
|
|
- Integral part of TRACE32
- Configurable as system under debug (PBI=SIM)
- Allows post-mortem debugging
- Software compatible to all TRACE32 tools
- OS-aware debugging
- Cache simulation (architecture dependent)
- Program and data flow trace based on a bus trace
protocol
- Advanced trace analysis features
- Powerful script language
- Programming interface for peripheral simulation
- Not available for processor architectures that
support user-defined instructions
|
|
|
| |
|
|
| |
|
|
| |
|
|
|
|
|
| |
|
|
| |
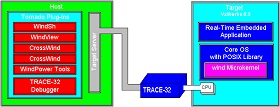
TRACE32 Front-End
|
|
| |
- Front-end to third-party virtual targets
- Front-end to third-party core simulators
- Front-end to third-party target servers
- Front-end to TRACE32 Back-End
- Same GUI as TRACE32 hardware debuggers
- Debug features as provided by third-party
software/TRACE32 Back-End
- Trace features as provided by third-party
software/TRACE32 Back-End
- Windows, Linux and MacOSX
Reprise RLM floating licenses
|
|
|
|
|
| |
|
|
| |
|
|
| |
|
|
|
|
|
| |
|
|
| |
ROM Monitor
|
|
| |
|
|
- Compatible with Emulator
- Support for C,C++ and ASM
- Communication via Eprom Simulator
- Communication via RS232 or customized .DLL link
- Windows9x, WindowsNT and Unix
- Monitor Code with Source
- Monitor Code Royalty Free
|
|
|
| |
|
|
| |
|
|
| |
|
|
|
|
|
| |
|
|
| |
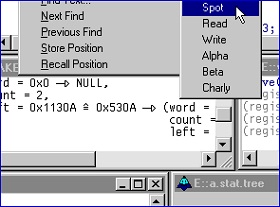
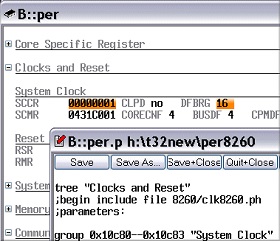
Logical Display of Peripherals
|
|
| |
- Display of onchip peripherals
- User definable windows
- Interactive window definition with softkey support
- Pulldown menues for selection of choices
- Additional description for each field
|
|
|
|
|
| |
|
|
| |
|
|
| |
|
|
|
|
|
| |
|
|
| |
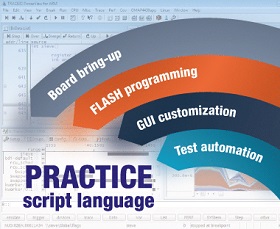
Script Language PRACTICE
|
|
| |
|
|
- Structured Language
- Menu Support
- Command Logs
- Custom Menues
- Custom Toolbars and Buttons
- Custom Dialog Windows
- 64-Bit Arithmetic
- Numeric, Logical and String Operators
- Direct Access to System States
|
|
|
| |
|
|
| |
|
|
| |
|
|
|
|
|
| |
|
|
| |
Trace-based Debugging (CTS)
|
|
| |
- Allows re-debuggging of a traced program section
- Provides forward and backward debugging capabilities
- High-level language trace display including all
local variables
- Timing and function nesting display
- Has the ability to fill most trace gaps caused by
the limited bandwidth of trace port
|
|
|
|
|
| |
|
|
| |
|
|
| |
|
|
|
|
|
| |
|
|
| |
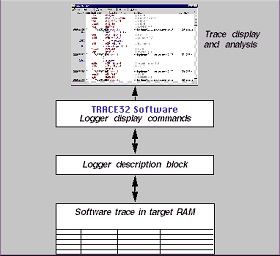
Logger
|
|
| |
|
|
- Software trace of any size stored in an array
structure on the target
- General trace format provided by TRACE32-PowerView
- Configuration and display commands provided by
TRACE32-PowerView
- Works as trace with address and data information
- Works as a program flow trace (SH4, PowerPC)
Time stamp possible
- Predefined algorithms to fill the trace provided by
Lauterbach
- User defined algorithms to fill the trace also
possible
|
|
|
| |
|
|
| |
|
|
| |
|
|
|
|
|
| |
|
|
| |
Snooper
|
|
| |
- Samples memory while application is running
- Support for special debug communication channels
- All trace display and analysis functions can be used
- Trigger on specific values
- Dynamic performance analysis
|
|

|
|
|
| |
|
|
| |
|
|
| |
|
|
|
|
|
| |
|
|
| |
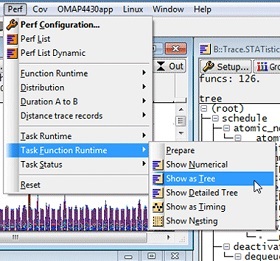
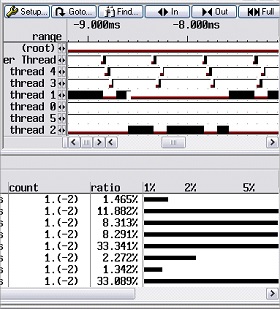
Trace-based Profiling
|
|
| |
|
|
- Detailed analysis of function run-times
- Detailed analysis of task run-times and state
- Graphical analysis of variable values over the time
- Analysis of the time interval of a single event
(e.g. Interrupt)
- Analysis of the time interval between 2 defined
events
|
|
|
| |
|
|
| |
|
|
| |
|
|
|
|
|
| |
|
|
| |
Sample-based Profiling
|
|
| |
- Long-time performance analysis for functions
- Long-time performance analysis for tasks
- Long-time analysis of the contents of a variable or
memory location and more
|
|
|
|
|
| |
|
|
| |
|
|
| |
|
|
|
|
|
| |
|
|
| |
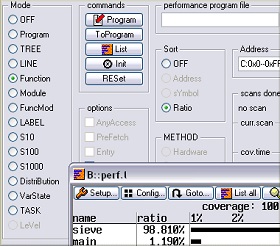
Trace-based Code Coverage
|
|
| |
|
|
- Real-time code coverage without instrumentation
- Suitable for long-term testing
- Support for all common code coverage metrics
- Automated report generation
- Full support of multicore chips
|
|
|
| |
|
|
| |
|
|
| |
|
|
|
|
|
| |
|
|
| |
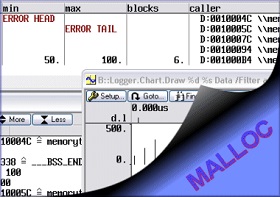
Memory Analysis
|
|
| |
- Display of allocated memory blocks
- Memory allocation Statistics
- Check for out-of-bounds writes
- Trace of allocation calls
- Graphical displays of memory usage
|
|
|
|
|
| |
|
|
| |
|
|
| |
|
|
|
|
|
| |
|
|
| |
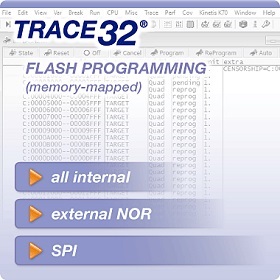
FLASH Programming (Memory-Mapped)
|
|
| |
|
|
- Optimum flash programming performance
- Support for all file formats
- Ready-to-run flash scripts
- Ready-to-use flash programming algorithms
- Dialog- or command-based programming as well as full
scripting
- Full awareness of sensitive data
- Flash declaration via CFI
- Easy handling of different flash types on a target
- Software breakpoints in flash
- Simple code patching in flash
- Flash programming via boundary scan
|
|
|
| |
|
|
| |
|
|
| |
|
|
|
|
|
| |
|
|
| |
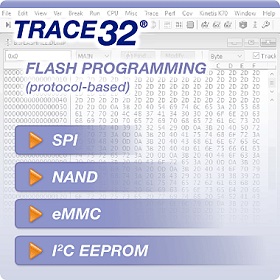
FLASH Programming (Protocol-Based)
|
|
| |
- Optimum flash programming performance
- Support for elf, Intel hex and S-record format
- Ready-to-use flash programming scripts
- Ready-to-use flash programming algorithms
- Memory dump for displaying the flash content
- Flash content can be easily copied and modified
- Flash programming via boundary scan (SPI, eMMC, I2C)
- Full programming access to spare area (NAND)
- Bad block treatment (NAND)
- ECC generation: Hamming, BCH, Reed-Solomon (NAND)
|
|
|
|
|
| |
|
|
| |
|
|
| |
|
|
|
|
|
| |
|
|
| |
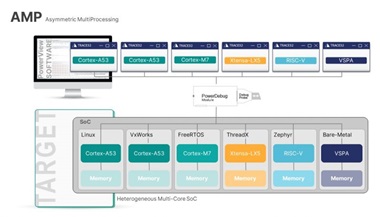
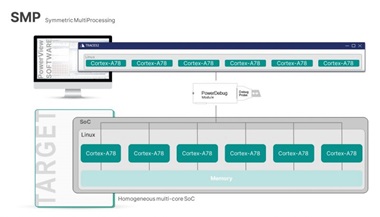
Multicore Debugging
|
|
| |
|
|
- Debugger for all cores of a multicore chip
- Debugging of application cores, DSPs, accelerator
cores and special-purpose cores
- Debugging of more than 80 core architectures
- Support for every multicore topology
- Support for all multicore operation modes
- Support for AMP and SMP systems
- Single debug hardware can be licensed for all cores
of a multicore chip
|
|
|
| |
|
|
| |
|
|
| |
|
|
|
|
|
| |
|
|
| |
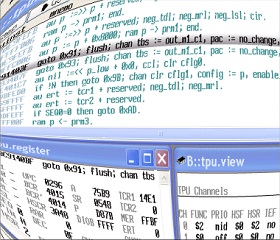
TPU Debugger (68332, MPC55x/56x)
|
|
| |
- Full support of TPU1, TPU2 and TPU3
- Step and Go commands
- Supports all TPU Breakpoints
- Disassembler for Microinstructions
- Monitor all TPU Registers during stepping
- Modify TPU internal Registers
- Display of Entry Points
- Peripheral View of TPU Registers
|
|
|
|
|
| |
|
|
| |
|
|
| |
|
|
|
|
|
| |
|
|
| |
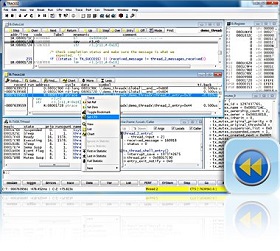
OS-aware Debugging
|
|
| |
|
|
- Real-time, non-intrusive display of RTOS system
resources
- Task stack coverage
- Task related breakpoints
- Task context display
- SMP support
- Task related performance measurement
- Statistic evaluation and graphic display of task run
times
- Task related evaluation of function run times
PRACTICE functions for OS data
- Easy access via RTOS specific pull-down menus
- Support for all major RTOSes
|
|
|
| |
|
|
| |
|
|
| |
|
|
|
|
|
| |
|
|
| |
3rd Party Tool Integration
|
|
| |
- Editor Integration
- CASE Tool Integration
- Kernel Integration
|
|
|
|
|
| |
|
|
| |
|
|
| |
|
|
|
|
|
| |
|
|
| |
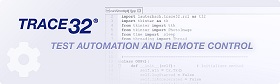
Remote Control
|
|
| |
TRACE32 Remote API
The TRACE32 Remote API enables Lauterbach
customers to control TRACE32 and access the
device under test from another program. Typical
use cases are:
- Integration of TRACE32 into an automated production
environment
- Using TRACE32 as an interface to the device under
test for test and measurement systems
- Using TRACE32 as an interface to the device under
test for third party tools
|
|
|
| |
|
|
| |
|
|
The TRACE32 Remote API can
be used to control several TRACE32 PowerView
instances simultaneously. This is possible by
establishing one socket stream per PowerView
instance. It does not matter whether the device
under test is a physical or virtual target or an
instruction set simulator.
|
|
|
| |
|
|
| |
|
|
| |
|
|
